KT Tip Sheets

Making Infographics Accessible and 508 Compliant
This KT Tip Sheet offers tips for designing infographics and visualizations that are accessible to people with disabilities, along with the steps to ensure your infographics are 508 compliant.
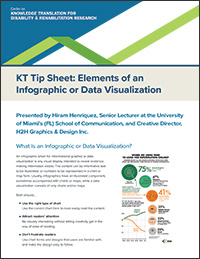
Elements of an Infographic or Data Visualization
This KT Tip Sheet details the elements of a graphic, from the main headline to sources.
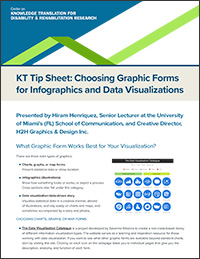
Choosing Graphic Forms for Infographics and Data Visualizations
This KT Tip Sheet showcases a variety of graphic types that can be utilized in your data visualizations and infographics.
Conceptualizing Infographics and Data Visualizations
This KT Tip Sheet outlines key factors to consider when designing your data visualizations and details the steps for creating an infographic or visual graphic, from initial research to final draft.
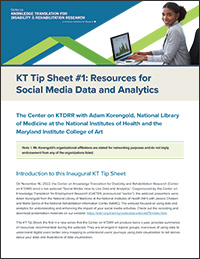
Resources for Social Media Data and Analytics
This KT Tip Sheet provides summaries of resources recommended during a November 2022 Center on KTDRR webcast, "Social Media: How to Use Data and Analytics." They are arranged in topical groups: overviews of using data to understand digital users better; story mapping to understand users’ journeys; using data visualization to tell stories about your data; and illustrations of data visualization.